Beyond Beliefs: How Our Actions Don’t Always Reflect Our Thoughts

Remember that rainy October morning in 2018? ( Myers & Twenge 2021). The Tree of Life synagogue shooting tragically highlighted a harsh reality: hatred online can lead to violence in the real world. This incident underscores the most common assumption that our beliefs and feelings directly influence our actions. But is this always true?

Social psychology delves into this fascinating question, exploring the complex relationship between attitudes - our inner world and behavior -our outer actions. While it is tempting to believe “ we are what we think”, things are rarely that straight forward.


The Myth of the Direct Link

imagine encountering someone with a negative attitude towards a specific group. We might expect their behavior to reflect that negativity, leading to discrimination or even aggression. However, research paints a more nuanced picture. The correlation between attitudes and behavior, though present, is often weaker than we think

Many Factors Influence Our Actions

  • Situational pressures - Even someone with strong beliefs might behave differently under social pressure or when faced with consequences.

  • Competing motives - Other values or goals might outweigh the influence of a specific attitude.

  • Lack of awareness - Sometimes, our implicit biases unconsciously shape our behavior without our conscious awareness.

The Power of Context:

Imagine two scenarios:

Scenario 1: You're having a heated debate with a friend about a controversial topic. Your negative attitude towards their viewpoint boils over, leading to harsh words and a strained relationship.

Scenario 2: You encounter someone with a different perspective while volunteering at a community event. Despite your internal disagreement, you prioritize cooperation and treat them with civility.

Both scenarios involve potentially conflicting attitudes, but the context shapes your behavior dramatically. Social pressure to "be nice" at the volunteer event likely outweighs your negative attitude, while the charged atmosphere of the debate amplifies its influence.

Understanding the intricate dance between attitudes and behavior is crucial. While our inner thoughts and feelings play a role, they are just one piece of the puzzle. Recognizing the influence of external factors and implicit biases allows us to make more informed judgements about ourselves and others.

References

Myers, D., & Twenge, J. (2021). Social Psychology (14th ed.). McGraw-Hill Higher Education (US). https://bookshelf.vitalsource.com/books/9781260888522

The Power and Peril of Intuition: How Social Psychology Can Help You Think Better


have you ever wondered why you can’t resist analyzing why someone acted the way they did? Or why your own beliefs shape how you perceive the world? The answer lies in intuition, a fundamental tool we use to navigate social interactions, but one that carries both advantages and pitfalls. Let’s delve into the fascinating world of social psychology and explore how understanding our intuitive thinking can enhance our lives

The Urge to Explain

We innately seek to understand why people behave the way they do. Whether it’s a friend’s insult or a heated sports match, we attribute actions to causes, making the world seem predictable and controllable. (Myers & Twenge, 2021)

The Lens of Our Beliefs

Remember the Princeton-Dartmouth football game? Fans saw fouls based on their team loyalty, highlighting how our beliefs and values color our perception. This applies to everything from political views to protesters’ actions. We may not always see objective reality, but rather a version filtered through our own mental framework.

The Intuitive Scientist

We are all amateur psychologists, constantly analyzing people’s behavior. We attribute consistent traits to individuals, like inferring a “nasty disposition” from repeated side remarks. It’s a quick and efficient way to navigate social interactions, but beware of oversimplification.

The Power of Self-Belief

Myers & Twenge (2021) state that your beliefs about yourself impact your emotions and actions. Optimists see control and superiority differently than pessimists, shaping their choices and experiences. Understanding your self-perception is crucial for self-reflection and growth.

Fast and Slow Thinking

Nobel laureate Daniel Kahneman describes our thinking as operating on two levels: intuitive (fast) and deliberate (slow ) (Myers & Twenge, 2021).

Intuition’s Pitfalls

While convenient, intuition can be misleading. Fear of flying over driving, despite statistics, exemplifies how vivid mental images can distort reality. We also overestimate our memory reliability, misinterpret our emotions, and predict our future inaccurately.

Empowering Our Thinking

Social psychology aims to harness intuition's strengths while mitigating its weaknesses. We can utilize "fast and frugal" judgments in everyday situations but engage critical thinking for important decisions. Recognizing intuition's limitations empowers us to make reasoned choices and avoid unnecessary anxieties.

Remember, understanding our intuitive mind is key to thinking effectively. By acknowledging its power and potential pitfalls, we can navigate the social world with greater awareness and make choices that align with our true values and goals. So, the next time you catch yourself making a snap judgment, pause and reflect. Is it your "intuitive scientist" at work, or could you benefit from engaging your "deliberate thinker"? By harnessing the full spectrum of our mental abilities, we can navigate life's complexities with greater wisdom and self-awareness.

References

Myers, D., & Twenge, J. (2021). Social Psychology (14th ed.). McGraw-Hill Higher Education (US). https://bookshelf.vitalsource.com/books/9781260888522

Are Social Psychology Findings Just Common Sense in Disguise?

 Social psychology explores the fascinating world of how people think, influence, and relate to each other. But have you ever thought, “Isn’t that just common sense?” This blog post delves into this very question, exploring the pitfalls of hindsight bias and its impact on our perception of social psychology findings

The Challenge of Hindsight Bias:

The biggest hurdle comes in the form of hindsight bias. This phenomenon tricks us into believing that past event were always predictable, leading us to judge ourselves and others harshly based on outcomes we couldn’t have truly foreseen. In social psychology, this translates to looking at research results and thinking, “Of course ! That makes perfect sense!” But did it before you knew the answer? (Myers & Twenge 2021)


 The Experiment:

The author proposes a thought experiment: tell different groups contradictory social psychology findings (opposites attract vs. birds of a feather) and ask them to explain and rate the surprisingness of each. Chances are, they'll find a good explanation and deem it unsurprising, regardless of the finding presented. This showcases how easily we fit results into our existing narratives, making them seem obvious in hindsight.

The Danger of Arrogance and Misjudgment:

Hindsight bias can breed arrogance, making us overestimate our own foresight and fueling harsh judgments of others for seemingly "obvious" mistakes. Take the 9/11 attacks as an example. Looking back, missed clues seem blatant, leading to accusations of incompetence. But were they genuinely predictable in real-time amidst incomplete information and complex situations?

Moving Beyond Common Sense:

Social psychology goes beyond confirming existing beliefs. It uses rigorous methods to uncover hidden patterns, challenge assumptions, and explore counterintuitive phenomena. While some findings may resonate with our experiences, others push the boundaries of our understanding, revealing the complexities of human interaction.

So, the next time you encounter a social psychology finding, resist the urge to dismiss it as common sense. Consider the research behind it, acknowledge the limitations of hindsight, and appreciate the more profound understanding it offers about the intricate dance of human behavior.

References

Myers, D., & Twenge, J. (2021). Social Psychology (14th ed.). McGraw-Hill Higher Education (US). https://bookshelf.vitalsource.com/books/9781260888522

Working with Ratio Scales


⏹️⏹️⏹️⏹️⏹️⏹️⏹️⏹️⏹️⏹️⏹️⏹️⏹️⏹️⏹️⏹️⏹️⏹️⏹️⏹️⏹️⏹️⏹️

Ratio Scales, Definition, Examples, and Data Analysis

  1. A ratio scale is quantitative with true zero and equal intervals between neighboring points.
  2. A ratio scale of zero means a total absence of the variable you are measuring.
  3. An interval scale does not have any of the above mentions.
  4. Length, area, and population are examples of ratio scales.
  5. The ratio level contains all of the features of the other 3 levels.
  6. At the ratio level, values can be categorized, and ordered, have equal intervals, and take on a true zero.
  7. Nominal and ordinal variables are categorical variables
  8. Interval and Ratio variables are quantitative variables
  9. Many more statistical tests can be performed on quantitative than categorical data


So What is a True Zero?? 🟥🟥🟥🟥🟥🟥🟥

  1. On a ratio scale, a zero means there's a total absence of the variable of interest.
    1. For example, the number of children in a household or years of work experience are ratio variables.
    2. A respondent can have no children in their household or zero years of work experience.
  2. With a true zero in your scale, you can calculate ratios of values.
    1. For example, you can say that 4 children are twice as many as 2 children in a household and eight years is double 4 years of experience
  3. Some variables, such as temperature, can be measured on different scales
    1. Celcius and Fahrenheit are interval scales
    2. Kelvin is a ratio scale
    3. In all three scales, there are equal intervals between neighboring points
    4. The Kelvin scale has a true zero, where nothing can be colder.
    5. That means that you can only calculate ratios of temperatures in the Kelvin scale
    6. A true zero makes it possible to multiply, divide, or square root values.
    7. Collecting data on a ratio level is always preferable to the other levels because it is the most precise.

Examples of ratio scales  ⏹️⏹️⏹️⏹️⏹️⏹️⏹️

  • Interval variables and ratio variables can be discrete or continuous.
  • A discrete variable is expressed only in countable numbers
  • A continuous variable can potentially take on an infinite number of values.

  • Number of vehicles owned in the last 10 years                                 discrete
  • The number of people in a household                                                      discrete
  • The number of students who identify as religious                                           discrete
  • reaction time in a computer task                                                                 continuous
  • Years of work experience                                                                                      continuous
  • Speed in miles per hour                                                                                      continuous


🟥🟥🟥🟥🟥🟥🟥🟥🟥🟥🟥🟥🟥🟥🟥🟥🟥🟥🟥🟥🟥🟥🟥🟥🟥


Ratio Data Analysis


  1. After you have collected ratio data, then you can gather descriptive and inferential statistics
  2. Almost all statistical tests can be performed on ratio data because all mathematical operations are permissible
  • Ratio data example - you collect data on the commute duration of employees in a large city
      • the data is continuous and in minutes
  • To summarize your data, you can collect the following descriptive statistics :
    • the frequency distribution in numbers or percentages
    • the mode, median, or mean to find the central tendency
    • the range, standard deviation, and variance to indicate the variability
  • You can get an overview of the frequency of different values in a table and visualize their distribution in a graph

  • Enter your data into a grouped frequency distribution table.
  • Create groups with equal intervals on the left-hand column and enter the number of scores that fall within each interval into the right-hand column.
  1. To visualize the data, plot it on a frequency distribution polygon.
  2. Plot the groupings on the x-axis and the frequencies on the y-axis
  3. Join the midpoint of each grouping using lines
Variability
  1. The range, standard deviation and variance describe how spread your data is.
  2. The range is the easiest to compute
  3. The standard deviation and the variance describe how spread your data is and they are also more informative.
  4. The coefficient of variation is a measure of spread that only applies to ratio variables
Range
  • To find the range subtract the lowest value from the highest value in your data set.
    • the range equals72.5 - 7 = 65.5
Statistical Tests

  • With a normal distribution of ratio data then parametric tests are best for testing hypotheses
  • Parametric tests are more powerful than non-parametric tests and you can make stronger conclusions with your data
  • The data must meet several requirements for parametric tests to apply
  • The following chart lists parametric tests that are some of the most common ones applied to test hypotheses about ratio data


🟥🟥🟥🟥🟥🟥🟥🟥🟥🟥🟥🟥🟥🟥🟥🟥🟥🟥🟥🟥🟥🟥🟥🟥

References

Bhandari, P. (2020, August 28). Ratio Scales | Definition, Examples, & Data Analysis. Scribbr. https://www.scribbr.com/statistics/ratio-data/


Ordinal Data:


Need help with ordinal data??

🟥🟥🟥🟥🟥🟥🟥🟥🟥🟥🟥🟥🟥🟥🟥🟥🟥🟥🟥🟥🟥🟥🟥🟥🟥🟥🟥🟥🟥🟥🟥

  • Ordinal data
    • classified into categories within a variable that has a natural rank order.
      • However, the distances between the categories are uneven or unknown.
      • For example, the variable frequency of physical exercise can be categorized into the following:


There is a clear order to these categories, but we cannot say that the difference between never and rarely is exactly the same as that between sometimes and often - therefore the scale is ordinal.

🟥🟥🟥🟥🟥🟥🟥🟥🟥🟥🟥🟥🟥🟥🟥🟥🟥🟥🟥🟥🟥🟥🟥🟥🟥🟥🟥


  • Ordinal is the second of four hierarchical levels of measurement
    • nominal, ordinal, interval, and ratio
  • Nominal data differs from ordinal data because it cannot be ranked in an order. 
  • Interval data differs from ordinal data because the differences between adjacent scores are equal.

🟥🟥🟥🟥🟥🟥🟥🟥🟥🟥🟥🟥🟥🟥🟥🟥🟥🟥🟥🟥🟥🟥🟥🟥🟥🟥🟥🟥🟥

Examples of Ordinal Scales:


  • In social scientific research, ordinal variables often include ratings about opinions or perceptions, or demographic factors that are categorized into levels or brackets such as social status or income.
    • Language ability
      • beginner
      • intermediate
      • fluent
    • level of agreement
      • strongly disagree
      • disagree
      • neither agree nor disagree
      • agree strongly agree
    • Income level
      • lower level income
      • middle-level income
🟥🟥🟥🟥🟥🟥🟥🟥🟥🟥🟥🟥🟥🟥🟥🟥🟥🟥🟥

How to Collect Ordinal Data 

  • ordinal variables are usually assessed using closed-ended survey questions that give participants several possible answers to choose from. These are user-friendly and let you easily compare data between participants.
⏹️⏹️⏹️⏹️⏹️⏹️⏹️⏹️⏹️⏹️⏹️⏹️⏹️⏹️
Examples of Ordinal scale survey questions

  • what is your age
    • 0 to 18
    • 19 to 34
    • 35 to 49 
    • 50 plus
  • what is your education level
    • primary school
    • high school
    • bachelors degree
    • master's  degree
    • PhD
  • In the past three months, how many times did you buy groceries online
    • none
    • 1 to 4 times
    • 5 to 9 times
    • 10-14 times
    • 15 or more times
⏹️⏹️⏹️⏹️⏹️⏹️⏹️⏹️⏹️⏹️⏹️⏹️⏹️⏹️⏹️⏹️⏹️⏹️⏹️⏹️⏹️⏹️⏹️⏹️⏹️⏹️⏹️⏹️


Likert Scale Data

Ordinal data is often collected using Likert scales. Likert scales are made up of 4 or more Likert type questions with continuum of response items for participants to choose from


Example of Likert-type questions 


  • How frequently do you buy energy-efficient products?
    • never
    • rarely
    • sometimes
    • often
    • always
  • How important do you think it is to reduce your carbon footprint?
    • not important
    • slightly important
    • important
    • moderately important
    • very important
  • But it's important to note that not all mathematical operations can be performed on these numbers
    • Although you can say that two values in your data set are equal or unequal
    • you can say that one value is greater or less than another.
    • You cannot meaningfully add or subtract the values from each other.
      • This becomes relevant when gathering descriptive statistics about your data.
How to Analyze Ordinal Data⏹️⏹️⏹️⏹️⏹️⏹️

  • Ordinal data can be analyzed with both descriptive and inferential statistics.

Descriptive Statistics⏹️⏹️⏹️⏹️⏹️

  • With Ordinal Data
    • the frequency distribution in numbers or percentages. 
    • the mode or the median to find the central tendency
    • the range to indicate the variability
  • Example 
    • You ask 30 survey participants to indicate their level of agreement with the statement below
      • Regular physical exercise is important for my mental health.
        • strongly disagree
        • disagree
        • neither disagree nor agree
        • agree
        • strongly agree

 ⏹️⏹️⏹️⏹️⏹️⏹️⏹️⏹️⏹️⏹️⏹️⏹️⏹️⏹️

To get an overview of your data, you an create a frequency distribution table that tells you how many times each response was selected

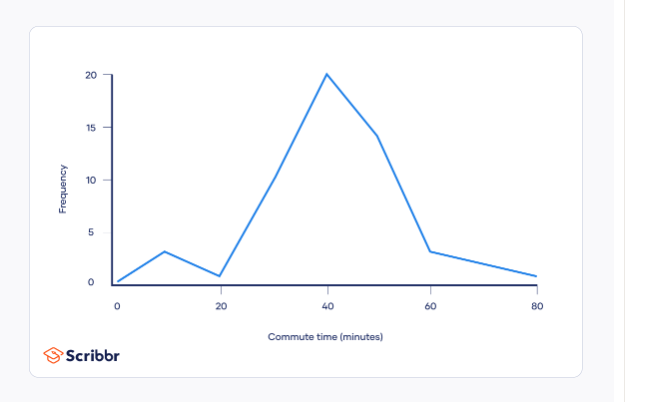
To visualize your data, you can use a bar graph
  • Plot your categories on the x-axis and the frequencies on the y-axis
  • Unlike nominal data,

    the order of categories matters when displaying ordinal data.

Central Tendency⏹️⏹️⏹️⏹️⏹️⏹️⏹️⏹️

The central tendency of your data is where most of your values lie
  • The mode, mean, and median are the three most commonly used measures of central tendency.
    • the mode can almost always be found for ordinal data
    • the median can only be found in some cases.
    • The mean can not be computed with ordinal data
      • finding the mean requires you to perform arithmetic operations like addition and division on the values in the data set
      • the differences between adjacent scores are unknown with ordinal data, these operations can not be performed for meaningful results.
      • the mode of your data is the most frequently appearing value.
        • the mode of the data set is agree
⏹️⏹️⏹️⏹️⏹️⏹️⏹️⏹️⏹️⏹️⏹️⏹️

Medians
  • for odd and even numbered data sets are found in different ways
    • in an odd numbered data set the median is the value at the middle of your data set when it is ranked.
    • In an even-numbered data set, the median is the mean of the two values in the middle of your data set.


  • Order all data values and locate the middle of your data set to find the median
    • Since there are 30 values, there are 2 values in the middle at the 15th and 16th positions since both values are the same the median is Agree
    • If the two values in the middle were Agree and Strongly agree instead, then you could not find the mean since the mean of the two values can't be found even if you coded them numerically - so in this case there is no median.
⏹️⏹️⏹️⏹️⏹️⏹️⏹️⏹️⏹️⏹️⏹️⏹️⏹️
Variability

  • Find the minimum, maximum, and range of your data set
    • code your data by assigning a number to each of the responses in order from lowest to highest.
      • 1 strongly disagree
      • 2 disagree
      • 3 neither disagree nor agree
      • 4 agree
      • 5 strongly agree
The minimum is 1 and the maximum is 5

  1. The range gives you an idea of how widely your scores differ from each other.
  2. From this information, you can conclude there was at least one answer on either end of the scale.

From this information, you can conclude there was at least one answer on either end of the scale.

Statistical Tests

  1. Inferential statistics will help you test scientific hypotheses about your data
  2. The most appropriate statistical tests for ordinal data focus on the rankings of your measurements and these just happen to be non-parametric tests
  3. Parametric tests are used when your data fulfills certain criteria like a normal distribution
  4. Parametric tests assess means
  5. non-parametric tests often assess medians or ranks.
  6. There are many possible statistical tests that you can use for ordinal data.
  7. The one you choose depends on your aims and the number and type of samples


🟥🟥🟥🟥🟥🟥🟥🟥🟥🟥🟥🟥🟥🟥
References


 Bhandari, Pritha. “Ordinal Data: What Is It and What Can You Do with It?” Scribbr, 12 Aug. 2020, www.scribbr.com/statistics/ordinal-data/.


Requiem for a Teaspoon: A Caffeinated Elegy


The Caffeinator: Dawn of Toxicity


🌡️🌡️🌡️🌡️🌡️🧊🧊🧊🧊🧊🧊🧊🧊🧊🧊🧊🧊🧊🧊 

Pure and highly concentrated caffeine products pose a significant public health risk due to their potency and potential for overdose. These products, often sold in bulk and packaged without precise measuring tools, contain dangerously high levels of caffeine - a single teaspoon of powder can be equivalent to 28 cups of coffee.  (Nutrition, 2023)


According to the FDA's 2023 article  (Nutrition, 2023), common side effects like nervousness are magnified, and potentially fatal consequences like seizures and rapid heartbeat can occur. Consumers unaware of this potency compared to regular coffee are particularly at risk. The FDA actively monitors and takes action against these products, including seizure and injunctions according to their recently published article (Nutrition, 2023). 

According to Nutrition (2023), the following is a timeline on the FDA's action on pure and highly concentrated caffeine:

  1. On September 1, 2015 - the FDA issued warning letters to five distributors of pure powdered caffeine products.
  2. March 2016 - The FDA issued two additional warning letters
  3. On April 13, 2018, the FDA released guidance for the industry on highly concentrated caffeine in dietary supplements
    1. This document provides guidance for companies who manufacture, market, or distribute dietary supplements containing pure or highly concentrated caffeine or are considering doing so, to help them determine when a product is considered adulterated and illegal by the FDA

🟥🟥🟥🟥🟥🟥🟥🟥🟥🟥🟥🟥🟥🟥🟥🟥🟥🟥🟥🟥🟥🟥🟥

 References

  1. Nutrition, C. for F. S. and A. (2023). Pure and Highly Concentrated Caffeine. FDA. https://www.fda.gov/food/dietary-supplement-ingredient-directory/pure-and-highly-concentrated-caffeine


Decoding the Data Whisperer:

 A Beginner's Guide to Z-Scores

🟥🟥🟥🟥🟥🟥🟥🟥🟥🟥🟥🟥🟥🟥


Imagine you're in a classroom full of students who all took the same exam. You scored 75, but how does that compare to everyone else? Did you ace it or just barely scrape by? Enter the z-score, a powerful tool that helps you understand your position within a dataset.


Think of z-scores as a translator. It takes your raw score and converts it into a universal language, telling you how many standard deviations away you are from the mean or average of the group. S standard deviation is basically a measure of how spread out the data is.


The lowdown on z-scores:


The Formula:


Interpretation:

Positive z-score means you scored above the mean, The higher the z-score, the further above the mean you are. For example, a z score of 2 means that you are 2 standard deviations above the average.


A negative z score means that you scored below the mean. The more negative the z-score, the further below the mean you are. 


A z-score of 0 then you are right on the mean.


Benefits of Z-Scores:
  1. you can compare apples to oranges. You can compare data from different sets with different units. Imagine comparing your exam score to your friend's height. Z-scores make it possible by putting both scores on the same scale.
  2. Spot outliers: Extreme values that deviate significantly from the rest of the data can be easily identified with z-scores. A z-score far above or below the others might indicate an error or a unique case that deserves further investigation.
  3. Predict probabilities: Knowing the z-score and the properties of the normal distribution-  the bell curve-, you can estimate the percentage of the population that scored lower or higher than you.


Featured Blog Post

Dante Faints at the Second Circle: A Story of Lust and Loss

 Dante's Inferno isn't just about fire and brimstone. It's a story of human emotions laid bare. We enter the second circle, wher...

Popular Posts